Errors in measurements translate into errors in everything calculated from that measurement.
Example:
Small error in measuring the position with time of your car create errors in calculating the velocity and acceleration of your car.
Copy this example data set into excel:
| Time (sec) | Position (in) |
| 0 | 0 |
| 1 | 2.5 |
| 2 | 10 |
| 3 | 22.5 |
| 4 | 40 |
| 5 | 62.5 |
| 6 | 86.25 |
| 7 | 107.5 |
| 8 | 126.25 |
| 9 | 142.5 |
| 10 | 156.25 |
| 11 | 167.5 |
| 12 | 176.25 |
| 13 | 182.5 |
| 14 | 186.25 |
| 15 | 187.5 |
Create new column in excel that calculate velocity and acceleration from the above data.
V2 = 2*(x2-x1)/(t2-t1) - V1
a = (v2-v1)/(t2-t1)
Answer check: Your spreadsheet should look like this:
Insert two more columns:
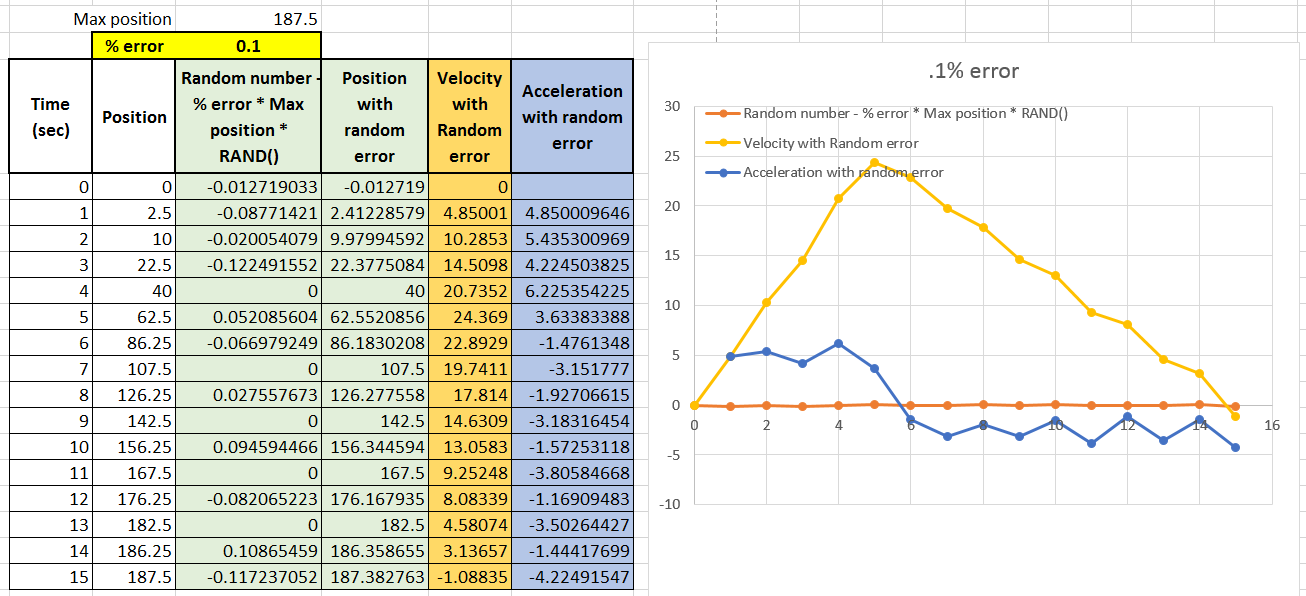
Create a random error using excel's random # generator, then add this random error to the position data.

$D$5 = % error (1)
RAND() = random number generator, generates random numbers between 0 and 1
RANDBETWEEN (-1,1) makes random number either positive or negative
Observe what happens to the velocity and acceleration data as you change the % error that is added in.
1% error:
Create an xy scatterplot of your velocity and acceleration data, and look at different error values:
0% error:

0.1% error
5% error:
Small errors in position = HUGE errors in velocity and acceleration!!!
So, what do we do with imperfect position data? (Note: the data you take in class will not be perfect, so this is what your initial vel and accelerations will look like)
Try this out:
Fit an equation to your imperfect position data, then create a new column for smoothed position data:

Note: you might have to create a new smoothed line for your best guess at Vel too...
Error propagation issues can be a pain!! Try and get the best data you can off of your video!


No comments:
Post a Comment